








Sample report · simulated, uncalibrated · synthetic part
What fails, why, and the change that fixes it.
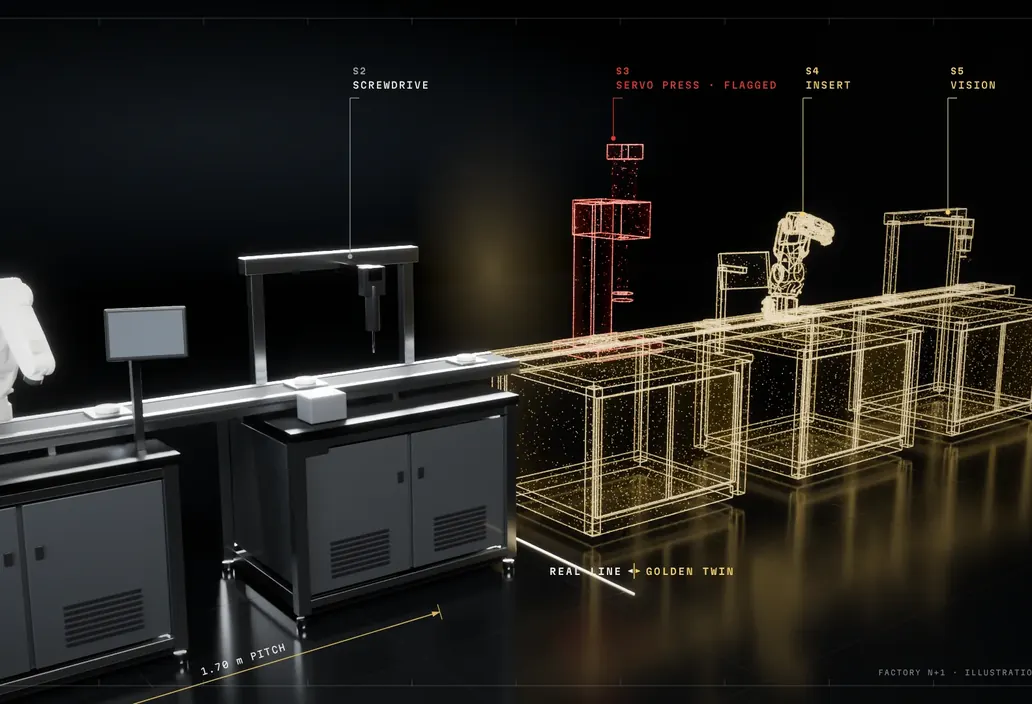
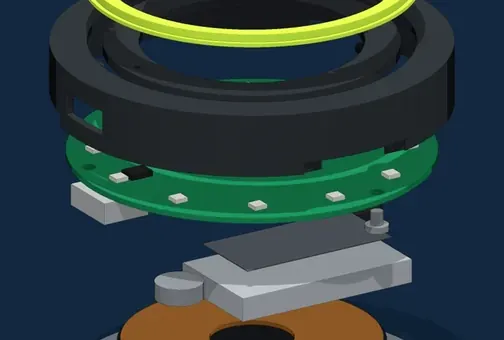
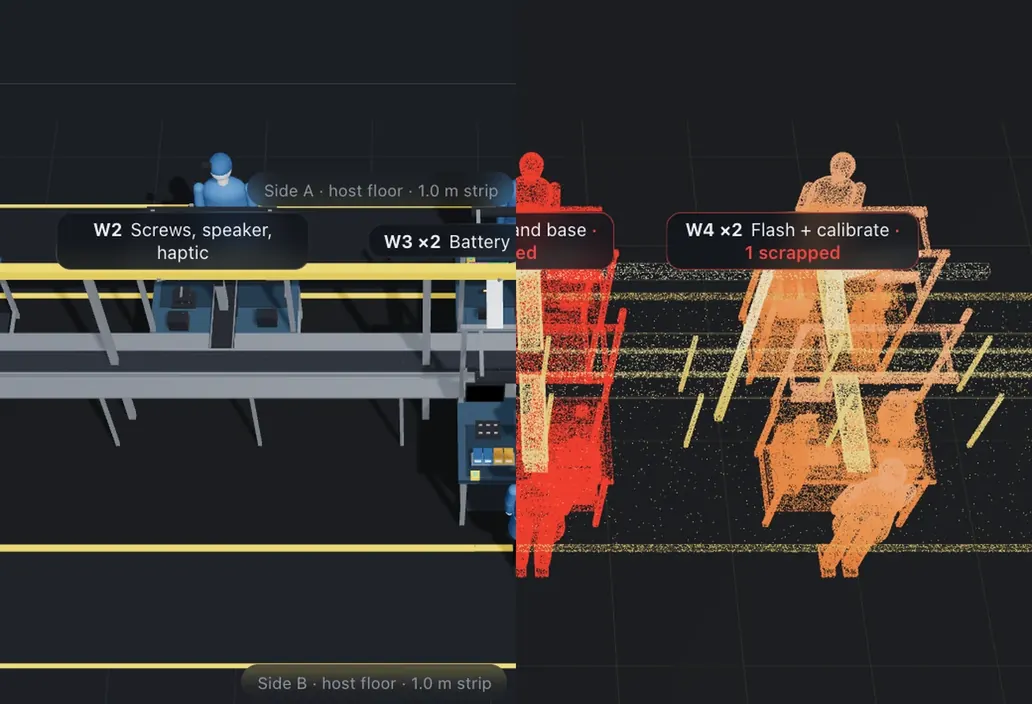
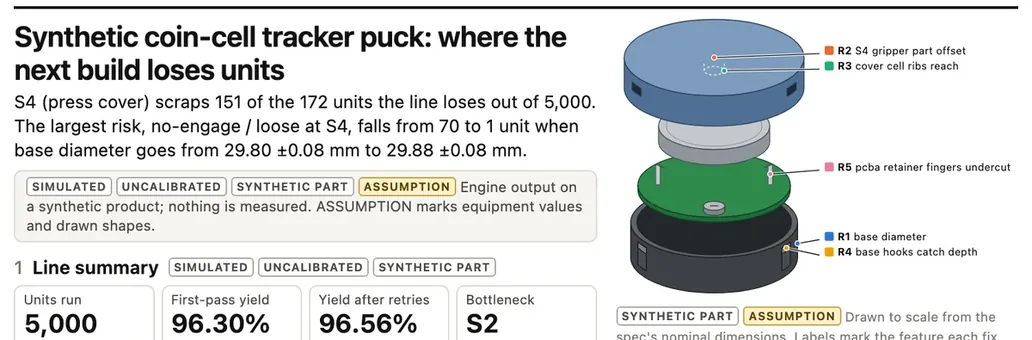
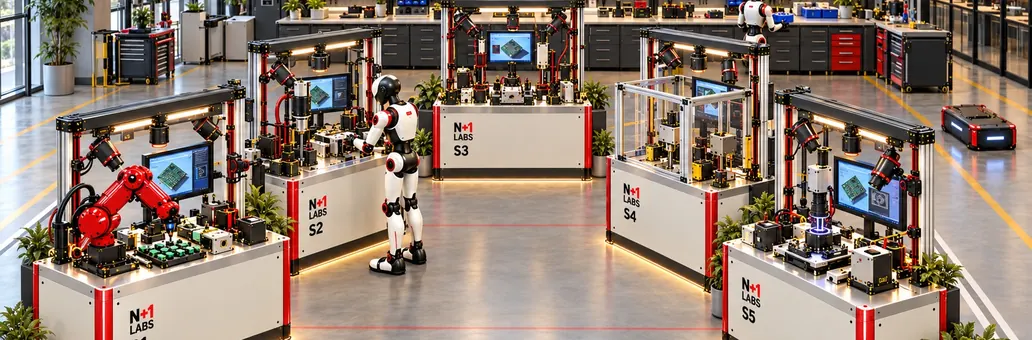
This is the report the engine writes, run on our tracker puck, a part we designed to test it. 5,000 simulated units go through a five station line. The failures are ranked by units lost, each with its cause and a fix the engine reran to check. Nothing in it is measured. Yours is built the same way from your files and your line, after a blind backtest on a build you already ran.
- 01The lineUnits lost at each of the five stations, and the simulated first pass yield.
- 02The risksFive risks, ranked by the units each one loses.
- 03The causesThe part tolerances and station errors behind each risk, from a sensitivity sweep.
- 04The fixesThe best of 16 reruns for each risk, with simulated yield before and after.
- 05The limitsWhat the model leaves out, and where its answer is unsure.
Simulated and not yet calibrated against a real build. The tracker puck is a synthetic part we designed to test the engine, not a customer’s. Every number in the report comes from one run of 5,000 units at seed 42, written by the engine and never typed by hand. The run’s data · The tracker puck line, station by station →